AmcoTax.Admin

About Angela Shannon

This author has not yet filled in any details.
So far Angela Shannon has created 101 blog entries.

How COVID-19 changed the market

The COVID-19 housing boom may have peaked in most parts of Australia but analyst CoreLogic has identified six ‘‘remarkable’’ shifts caused by the pandemic over the past two years that will have a long-term effect on national property markets.

Record house prices and buyer debt lead the pack. Close behind are rental increases and yield falls, a spike in first-home buyer numbers, the shift to the country and a widening chasm between house and unit pricing.

‘‘The global pandemic has catalysed remarkable shifts in the Australian housing market,’’ CoreLogic says in a new report, Two years on: Six ways COVID-19 has shaped the housing market.

‘‘From the temporary shutdown of cities, to an unprecedented monetary policy strategy, the COVID-19 period has had distinct impacts on the composition of buyers and the dynamics of the housing market.’’

The most obvious impact is on housing prices. According to CoreLogic’s Home Value Index, home values across Australia leaped 25 per cent to record highs in the two years to the end of February. The median national dwelling value increased $174,000 to $728,000 over the same period.

First home buyers, fuelled by grants such as the federal government’s HomeBuilder payments, fired up the market in 2021, mirroring what happened a decade before when the First Homeowner grant was temporarily boosted in 2009-10.

But that turned out to be a sugar hit and when the government money dried up and house prices increased, first-home buyer demand returned to its long-term average of 24 per cent of all owner-occupiers.

Through this period rents rose 12 per cent, once again to record highs, the fastest growth since 2008.

Conversely, gross yields for investors fell to a record low of 3.21 per cent as purchase prices increased at a faster rate. The median national rent is now $470 a week.

‘‘As housing growth has started to slow, this record low gross rent yield figure appears to have begun stabilising,’’ CoreLogic said.

Housing debt surged, obliterating previous benchmarks, as buyers borrowed more to get into a fast-moving market.

The ratio of housing debt to household income reached 140.5 per cent in the second half of 2021. Home loan volumes are still exceptionally high, with new loan commitments totalling $33.7 billion in January.

CoreLogic said rising debt levels ‘‘creates a vulnerability’’ in the Australian economy, but high asset values and low interest rates reduced the risks, it said.

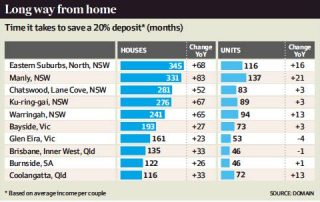
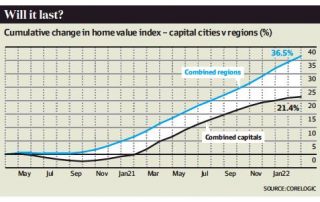
People want more space than ever, driving trends five and six: the divergence of house and apartment prices and much higher levels of migration from cities to the regions.

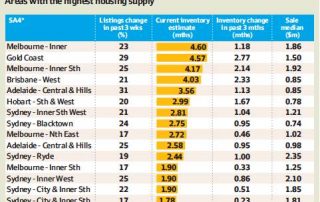
When combined with a shortage of stock, this caused regional housing prices to grow at almost twice the speed of city properties – 36.5 per cent compared with 21.4 per cent.

However, growth in most markets is now moderating, the report says.

How COVID-19 changed the market2022-03-25T14:11:10+11:00

Nearly a year more to save a deposit

The time it takes for a couple to save a 20 per cent deposit to buy an entry-level house has blown out by an extra 11 months during 2021 – nearly three times longer than the additional time recorded in the previous year – but the slowing market could offer a reprieve for first home buyers in the year ahead.

Aspiring home owners could now need as long as five years and eight months to save up for a deposit across the combined capitals as prices have surged to record highs, the Domain’s annual First Home Buyer report finds.

Sydney’s 33.1 per cent house price growth for 2021 would require first-time buyers to save for an additional 18 months – more than three times longer than the additional time needed in the previous year – for a total of eight years and one month.

The extra time needed to save the 20 per cent deposit has more than doubled in Canberra, Hobart and Adelaide and climbed six-fold in Melbourne during the past year.

It would now take home buyers seven years and one month to save for the deposit in Canberra, five years and 10 months in Hobart, four years and seven months in Adelaide and six years and six months in Melbourne.

‘‘In a climate where incremental wage growth and rising mortgage repayments and rental prices are paired with escalating property prices, the prospect of saving the lump sum deposit is becoming more challenging,’’ said Nicola Powell, Domain’s chief of research and economics.

‘‘We’ve got tight vacancy rates and with the international borders reopening, we’re likely to see rents continuing to rise, which makes it tough for renters to put spare cash aside for that deposit.’’

For first home buyers willing to compromise on the housing type, units offer a faster way to get into the property ladder, Dr Powell said.

‘‘Unit prices growth was more modest compared to houses, which means you need a smaller deposit,’’ she said.

It still took first home buyer and social worker Holly Marchioni more than four years, working two jobs and saving diligently to come up with the required amount to buy her two-bedroom unit in Bendigo, Victoria. ‘‘I was studying full time to become a social worker when I first started working two jobs to save the deposit because I really wanted a place of my own,’’ she said.

‘‘I’ve since graduated and am now working full time, but I continued to work two jobs because prices have risen so much. It was terrifying to see prices go up within weeks or months, so I decided to ramp up my savings and buy as soon as I had saved enough money.

Across the combined capitals, first home buyers would shave two years and two months if they opted for a unit rather than a house.

Buyers would cut two years and seven months in Sydney, two years and two months in Melbourne and three years and four months in Canberra.

Aspiring home owners buying a unit in other capitals will slash between one year and one month to a year and eight months.

The prospects of a higher interest rate later this year could help shorten the time needed to save a deposit as prices fall, Dr Powell said.

‘‘We’re already seeing various metrics soften, which indicate the market is moving into the next stage of the property cycle,’’ she said.

Nearly a year more to save a deposit2022-03-25T13:53:05+11:00

How hard do we hit Russia?

The West has yet to use its full arsenal of measures against the Russian economy. What is the most effective thing it could do now?

The elephant in the room in the discussions about Ukraine is just how hard the US and Europe really want to hurt Russia.

The United States could bring Russia to its knees economically within days, via full exclusion of all Russian banks from the SWIFT system and by blocking all clearing in US dollars. It has chosen not to do so.

The SWIFT system sits at the very top of Western property right transfers.

Russia and much of eastern Europe were not a part of the Roman Empire that laid the basis of the Western legal system.

Compiled by Emperor Justinian (the Corpus Juris Civilis) and further developed in the Napoleonic code, civil rights, contract law, and land and property registries were well established. The Charlemagne and Hapsburg empires brought Germany, the Czechs and Poland into the fold.

Russia has never had anything like this legal structure. Communism (with no belief in private property) followed the tsars, leaving the country nothing to fall back on when the Soviet Union collapsed. The KGB fraternity was best placed and organised to steal the state companies in the vacuum created, and to adopt the tried-and-true law of ‘‘do as I say, or else’’.

Ukraine is courageously trying to move away from Russia’s idea of property rights, towards the Western model.

Russia and China both ignore the rule of law and international agreements as they see fit, the latest example being Russian atrocities that ignore the Geneva Conventions (that Moscow signed and ratified). For hundreds of years the tsars did what we observe in Ukraine today.

China too eyes Taiwan and other territories with no basis in law.

None of this is new, yet Europe, and Germany in particular, appear to have been willingly oblivious: living in a sort of ‘‘pacifist bubble’’, enjoying consumerism and growth dependent on the whims of Russia with respect to energy.

Having miscalculated on the military front, Russia has now asked China for help to overcome its property rights problems with the West.

The Russian military miscalculation is that the lessons of history have not been understood by Vladimir Putin. He should have read more Tolstoy: ‘‘Nobody spoke a word of hatred for the Russians. The emotion felt by every Chechen was stronger than hatred. It was … a feeling of such disgust, revulsion and bewilderment at the senseless cruelty of these creatures that the urge to destroy them was as natural as that of self-preservation.’’

This is what Putin’s army of 150,000 soldiers is up against today, in a country of 45 million people that is 1260 kilometres across and does not want to be subjugated.

Russia must also be surprised at how co-ordinated the response of the West has been, and could still be again.

In responding to Russia’s plight, China now faces major dilemmas. It could help Russia to evade sanctions by buying less oil and gas from the Middle East and more from Russia. China can also supply Russian consumers. This could help Russia avoid capitulation.

However, overt help for Russia may draw China into the property rights firing line.

The table sets out Russia’s foreign exchange reserves situation to February this year. Russian Finance Minister Anton Siluanov told state television that about $US300 billion ($405 billion) of the $US630 billion reserves is ‘‘usable’’. This would provide about one year of import cover. Gold is very usable (and easy to deliver to China if needed), and likewise for assets located in China. Together they are worth $US224 billion, which implies about $US76 billion is coming from elsewhere ($US80 billion if the currencies column on the right-hand side of the table is used).

This is interesting because this ‘‘extra’’ could only be assets in countries that are supposedly covered by the sanctions – I am thinking of the leeway being given to European transactions for Russian energy, and of course deposits in Switzerland (estimates suggest $US200 billion of Russian money is there, enjoying property rights not available at home).

For debt servicing the situation is somewhat better, as it applies only to Russia’s foreign debt of $US480 billion or so (internal debt is of no consequence for the issues considered here). The debt service ratio is around 12.1 per cent. Russia would need to come up with only $US58 billion a year (so usable reserves would cover about five years of servicing).

Talk of defaults is therefore somewhat puzzling. It’s either because (a) the US won’t let Russia pay funds due to Western entities, such as money owed to a US bank (possible, but unlikely); or (b) with its usual respect for contract law, Russia is singling out US dollar holders. Frivolous offers to pay in roubles underline its lack of form in contract law.

China would not like to see the US test its full arsenal of measures on Russia, which could one day be used against Beijing. It is therefore likely to opt for face-saving compromises rather than escalate the situation.

The US, by focusing SWIFT restrictions on only some of Russia’s banks, is also looking to avoid escalation. But this is a very weak restriction. By allowing some banks to continue to operate, all Russian banks can get by. This is the very nature of regulatory arbitrage that we saw in the run-up to the financial crisis.

Unless all Russian banks are treated the same way all over the world, they will get by for any obligations they care to meet. Europe will continue to pay for its gas, while Russia will use this to pay for imports, any debt service it chooses to honour, and possibly weapons. Indeed, with rising energy prices and European payments for its supply, Russian reserves could just as easily go up rather than down. They would not be a constraint at all.

The US appears to give weight to concerns about stumbling unintentionally into a nuclear conflict with Russia – like the stumbles that led to the outbreak of World War I in 1914.

One issue here is whether Putin is really crazy, or whether he likes to pretend he is so that his threats carry more weight. I am sceptical on the former, because the Russians do love their children too, and the oligarchs love their global wealth.

For the US, the main issue therefore is the European alliance. European nations may be willing to pay more for their energy, but they don’t want their supply to be cut off. Understandable. So, this takes me back to the benefits of the Roman Empire and the Napoleonic code.

A middle course that cuts off money to Russia temporarily and keeps energy supply moving would be for the gas payments to be fully sequestered (before going into the SWIFT transfer system) until the crisis is resolved. The reserves constraint would become more binding without having to collapse the financial system.

While Russia does not follow the rigours of Roman contract law, it should be happy with that compromise arrangement, because we do follow those rules.

Adrian Blundell-Wignall writes on the world economy and is a former director of the OECD.

How hard do we hit Russia?2022-03-25T13:44:57+11:00

Sydney’s inner suburbs post sharp price falls

House prices in some of Sydney’s inner suburbs have slumped by more than $190,000 in the past three months to February as the market slowdown accelerated amid poor affordability, tighter lending and higher fixed interest rates, CoreLogic data shows.

Beaconsfield posted a 9.2 per cent drop in median house value to $1.77 million, the largest percentage decline recorded in any house market in the country. Prices are now $162,662 lower than three months ago.

Newtown house prices fell by 6.6 per cent or $120,207 to $1.821 million, Surry Hills dropped by 6.1 per cent or $134,054 to $2.197 million and Birch-grove lost 6 per cent or $190,581 to $3.176 million.

Eliza Owen, CoreLogic’s head of research, said the premium end was more volatile compared to the lower end, but the very high growth recorded earlier in the cycle has also dampened demand.

‘‘I think affordability constraints, tighter lending conditions and higher fixed rates have likely been enough to cool premium markets, and the sharpness of the fall relates to the volatility in the high end of the market, and the extremely strong run up in price growth,’’ she said.

‘‘I think it’s a reflection of how strong the upswing in the more expensive central markets has been.’’

In Melbourne, house prices in inner suburbs Prahran, Cremorne, South Yarra and Windsor tumbled by more than 5 per cent, while Toorak dropped by 4.7 per cent during the same period.

In the apartment sector, prices in Barangaroo plummeted by 8.5 per cent, while Box Hill in Melbourne’s inner east lost 5.3 per cent. Nerida Conisbee, Ray White chief economist, said many home buyers were now struggling with the higher home prices.

‘‘The number of buyers has been reduced significantly because of affordability issues,’’ she said. ‘‘I think many buyers simply can’t afford houses because they’re now too expensive and people’s ability to pay such large sums have diminished somewhat.’’

While some premium areas such as Sydney’s Rodd Point still racked up a strong gain of 7.3 per cent during the past three months, the more affordable, outer ring suburbs have dominated the quarterly best performers.

House prices in Silverdale in Sydney’s outer west rose by 6.9 per cent, Camden South and Leppington added 6.3 per cent and Asquith gained 5.7 per cent.

In Melbourne, the top performing house markets were all located on the Mornington Peninsula, such as Safety Beach, Dromana, Tootgarook and Mount Martha which notched house price growth between 5 per cent and 5.8 per cent in the past three months.

In Brisbane, suburbs with median values under $1 million posted the largest rise in house values in the past three months. Kooralbyn and Logan Central notched more than 14 per cent growth each, while Eagleby, Sheldon and Beaudesert rose by more than 13 per cent.

In the unit market, New Port in Adelaide west logged the highest quarterly rise of 11.7 per cent, followed by Tanah Merah and Waterford in Brisbane’s Logan area with 11.1 per cent and 11 per cent growth respectively.

Ms Owen said the affordable end of the market would continue to outperform the upper end as the broader market slowed.

‘‘Based on historical performance of property values, I think the next 12 months should see more steady performance in affordable segments of Sydney and Melbourne, and possible regional markets of Australia,’’ she said.

‘‘This is because more affordable segments tend to have less volatility in growth rates – the highs are not as high, but the lows are not as low,’’ she said.

Sydney’s inner suburbs post sharp price falls2022-03-11T16:25:21+11:00

House prices set to fall as vendors rush to sell

A surge in listings across some of Melbourne’s inner suburbs could trigger faster-than-expected house price falls, as buyer demand eases amid higher mortgage rates, rising uncertainty and poor affordability, new analysis shows.

Melbourne’s inner areas, the inner south, inner east and the north-east have all posted above-average stock levels in the past three weeks as more vendors decide to cash in, Suburb-trends director Kent Lardner said.

The inventory level in Melbourne’s inner Stonnington West has jumped to 4.6 months after listings climbed by 23 per cent, while stock in Stonnington East has more than doubled to 4.17 months compared to the long-term average, Suburbtrends data shows.

‘‘The inner Melbourne market has swung back in favour of buyers as close to 2.2 per cent of owners have decided to list in recent weeks, which may be a tipping point for these suburbs,’’ Mr Lardner said.

‘‘In recent months, the Stonnington region has experienced a fall in median prices, which we estimate [to be] a 9 per cent drop . . . in the last 12 months. Unless demand increases, prices may fall further and faster if listings volumes continue to build like this.’’

Listings of less than 30 days rose sharply around the country over February, according to SQM Research. Sydney’s new listings jumped 81 per cent while Canberra soared 86.1 per cent. Melbourne’s new listings climbed by 76.7 per cent, Brisbane was up by 51.8 per cent, Adelaide by 53.4 per cent and Hobart by 53.3 per cent. Darwin rose by 71.3 per cent, Perth by 43 per cent and the new listings nationally increased by 62 per cent.

‘‘The upward surge in listings over February suggests some sellers are taking profits after phenomenal price rises were posted in 2021,’’ SQM Research managing director Louis Christopher said. ‘‘We could see the upward trend in listings continue through the first half of the year as more sellers seek to take profits.’’

In Melbourne’s inner east, new listings more than doubled to 2488 over the month to February as more vendors entered the market, according to SQM Research data.

‘‘There’s been a large pick-up in listings in the area, and we’re now seeing the pendulum swing towards the buyers in this market,’’ Mr Christopher said.

Stock levels have also risen sharply in Sydney’s inner west, with new listings jumping by 88 per cent in February.

‘‘The stock build-up is likely a reflection of the slower spring season, but also a rise in vendors wanting to sell despite the slowdown in the market,’’ Mr Christopher said.

But the large rise in listings in the area was unlikely to tip the market towards buyers yet, Mr Lardner said.

‘‘It will improve choices for buyers, but conditions remain red hot in this area, and there’s still strong upward pressure on prices,’’ he said.

‘‘The Leichhardt region has had a strong imbalance between buyers and sellers for over a year now. Even though listings volumes have increased, the number of buyers appears to be more than a match for the additional supply.

‘‘Inventory levels still remain low at close to one month. This means if nothing else is listed for sale, in theory we would have nothing available to sell in four or five weeks’ time, so it will take a considerable boost in listings volumes or a large reduction in buyers before we see conditions easing here.’’

The Bankstown area in Sydney’s inner south also posted a sharp rise in listings, but it would probably be absorbed quickly, Mr Lardner said.

‘‘Listing rose 21 per cent and prices are levelling out at a median of $1.2 million, however the market is still tipped slightly in favour of sellers,’’ he said.

House prices set to fall as vendors rush to sell2022-03-11T16:23:55+11:00

Women buy more homes as real estate gap narrows

The number of women who bought a home last year rose to nearly match male buyers, despite the persistent gender pay gap and multiple lockdowns during the pandemic, analysis by CoreLogic shows.

During the past year, the share of property purchases by women climbed by 0.9 percentage point to 28.3 per cent from 2020. Over the same period, the proportion of homes bought by men dropped by a similar amount to 29.6 per cent. The remainder of the purchases is by couples.

‘‘COVID-19 and the past year have seen mixed wealth and income outcomes for women, as remote work arrangements threatened to land women with more unpaid carer work, particularly while children were learning remotely, and the health system became more strained,’’ said Eliza Owen, CoreLogic’s head of research.

‘‘Interestingly, however, the past year saw a lot more parity between property sales associated with women and men, which I think could be linked to relatively low concentrations of investor activity, government schemes that help with deposit hurdles, or the increased role of intergenerational wealth in housing where parents help their children do so irrespective of gender.’’

Melbourne-based Mickayla Chapman, who recently bought her first home through ME Bank, said while it took her two years to save the deposit, the financial help from her parents enabled her to buy a two-bedroom, two-bathroom apartment in Reservoir quicker than most people.

‘‘I sacrificed a lot when saving for a deposit and really watched my expenses,’’ she said. ‘‘I was lucky to have my parents help with my deposit, so I could buy sooner.

‘‘It was an overwhelming process, but it was worth it. Buying my home allows me greater freedom, security, and a sense of accomplishment. It’s an asset that could grow in value, but most importantly, a place I could call my own.’’

Ms Owen said the share of properties bought by women had been rising.

‘‘Australia shows a really interesting trend where there’s a marginal shift, year by year, of women purchasing a slightly higher portion of properties, and men purchasing a slightly lower portion,’’ she said.

‘‘This positive trend may start to reflect greater gender parity in home ownership over time.’’

The average loan size for women applying for a single mortgage increased by 7 per cent to $411,752 in 2021 compared with 12 months prior, while the overall proportion of single female applications increased by 1 percentage point to 50 per cent.

In comparison, single male applications rose by 6 per cent to $449,273 in 2021 compared with 12 months prior, while the overall proportion of single male applications fell by 1 percentage point to 50 per cent.

Despite the encouraging trend, the share of home ownership among women has continued to lag men, according to CoreLogic.

Just 26.6 per cent of homes were owned by women, compared with nearly three in 10 (29.9 per cent) owned by men as of January this year.

Milena Malev, CoreLogic International’s general manager for financial services and insurance solutions, said property price increases might have further exacerbated the gender wealth gap in property ownership.

‘‘Given there’s a high level of equity held in real estate, if you don’t own property, that’s a big source of household wealth and security you don’t have access to,’’ she said.

‘‘Property price growth has also vastly outpaced income growth over this time, with the gender pay gap widening in parallel, too.’’

The gender pay gap in full-time ordinary earnings rose from 13.4 per cent at November 2020 to 13.8 per cent in November 2021, according to ABS data. This means men can save the 20 per cent deposit for the current median dwelling value about a year faster than women, said Ms Malev.

‘‘Men are not only accumulating greater wealth from a higher proportion of existing property ownership, but they’re also able to get into the market sooner than women and start that wealth accumulation in a growth market,’’ she said.

CoreLogic also found that men owned 28.5 per cent of all the houses analysed, compared with just 24 per cent owned by women.

‘‘Detached houses generally accumulate more value over time than units, so this essentially accentuates any wealth disparity that comes from housing,’’ said Ms Owen. ‘‘If it continues to widen, then so too would the wealth gap in housing.’’

Women buy more homes as real estate gap narrows2022-03-11T16:21:22+11:00

Western Sydney set for industrial land price rush

Western Sydney industrial land values are tipped to rise by up to 25 per cent this year after growing around 50 per cent in 2021.

Agent David Hall, national director of industrial at Colliers, said he had never seen anything like it.

Based on deals he was now working on, Mr Hall said prices were already 10 per cent to 15 per cent above what was achieved at the end of last year.

‘‘There’s very limited options left for groups to buy, and we’re still tracking over $2.5 billion worth of capital chasing industrial land in Sydney,’’ he said.

‘‘That tells me if you were to ask ‘what does the horizon look like?’, I’d say somewhere between 20 and 25 per cent growth again this year.’’

A key factor is rising industrial rents. ‘‘Groups running development feasibility studies at higher rents are going to have the ability to pay a higher residual land value than previously,’’ Mr Hall said.

The ‘‘only thing stopping it growing at the same rate as last year is that some of that rental growth will be offset by increased construction pricing’’, he said.

‘‘So that will put a limit, to some degree, on how hard growth will go this year. But in saying that, there’s nowhere the amount of options coming to market that we saw last year.’’

In its latest Industrial Development Update for Western Sydney, Colliers said the region’s land values grew by 17 per cent in the first half of 2021 and double that from July to December, when they rose 34 per cent.

Supply is shrinking, with an estimated 1805 hectares of net developable industrial land available, 9.5 per cent less than in mid-2021.

‘‘With uncertainty remaining around the volume of industrial land within the Aerotropolis [at Badgerys Creek], this undersupply is expected to persist in the short to medium term,’’ the report said.

‘‘Fragmented ownership remains one of the largest barriers to development within western Sydney.’’

Issues in getting development land to market, such as the provision of services, mean that as little as 227 hectares of industrial land could be developed in western Sydney this year.

‘‘Demand has been extraordinary, with over 260 hectares taken up in 2021, which was almost double the levels recorded in 2020 and the long-term average,’’ Mr Hall said.

‘‘The take-up of land was strongest within the Kemps Creek and Eastern Creek precincts.’’

Western Sydney set for industrial land price rush2022-03-11T16:19:40+11:00

Housing prices set to fall up to 11pc, NAB says

House prices will end the year ‘‘roughly flat’’ before dropping 11 per cent or more in the biggest markets of Sydney and Melbourne next year, NAB’s latest forecast says.

The bank’s revised forecast in its quarterly residential survey, comes just two days after Reserve Bank governor Philip Lowe conceded interest rates could start rising later this year, a possibility economists already anticipated.

The markets are pricing in as many as four increases this year while borrowers are already signing up to fixed-rate mortgages at a higher cost.

‘‘In terms of forecasts, we have brought forward the timing of the correction we expect in house prices to late 2022 as affordability constraints begin to bite and rising mortgage rates place downward pressure on prices,’’ NAB chief economist Alan Oster wrote in the survey released on Friday.

‘‘This would offset gains seen in early 2022, so that overall, prices end the year roughly flat. We see this trend continuing through 2023, ending the year about 10 per cent lower.

‘‘We expect this pattern to be evident across the capital cities, though for larger declines to occur in Sydney and Melbourne, while Brisbane and Adelaide see less significant declines.

‘‘However, we do not see these declines as disorderly, with the labour market remaining strong, wages growth picking up and rates still relatively low – though steadily increasing.’’

NAB expects house prices in Sydney to end 1.9 per cent higher this year, with Melbourne posting a mere 1.2 per cent gain. Brisbane and Hobart have the best prospects, with forecast gains above 4 per cent this year.

House prices across all state capitals will fall in 2023 on NAB’s view, with Sydney and Melbourne leading the charge lower with drops of 11.4 per cent in both cities.

‘‘With our view on rate hikes coming forward, we now expect the turning point in property prices to occur in the second half of 2022,’’ Mr Oster wrote. ‘‘We see this as a relatively orderly decline … it is important to remember this correction comes after a very sharp run-up in prices over the last year.’’

The credit-fuelled housing boom added nearly $1000 a day to Sydney house prices, which finished the year 29.6 per cent higher. Nationally prices rose 24.5 per cent over 2021.

But that incredible surge was already showing signs of easing before Dr Lowe addressed the National Press Club on Wednesday, when he acknowledged interest rates may rise this year.

‘‘If things go well and the economy performs stronger, there are clearly scenarios where we’d increase rates later this year,’’ Dr Lowe said.

Signs of deceleration were evident in Core Logic’s January house price data this week, showing house prices nationwide rose 1.1 per cent in January.

But the tempo in the biggest markets is winding back more rapidly, with Sydney adding just 0.6 per cent to home values and Melbourne, increasing by 0.2 per cent.

Although house prices typically lag changes in interest rates, the large amounts of debt needed to secure homes could make prices more sensitive to rising credit costs this time around.

The Commonwealth Bank of Australia has also begun tempering its expectations for the house price growth, noting the moderation in monthly gains. CBA has previously forecast a lift in prices of 7 per cent this year, before a fall of 10 per cent in 2023.

Housing prices set to fall up to 11pc, NAB says2022-02-11T12:36:02+11:00

Owner-occupier home loans grow again in December, but not for ANZ


AFR Article_ 09.02.2022

Australia and New Zealand Banking Group’s mortgage market woes got worse in December, despite assurances late last year that the bank would return to growth this half.

Data from the Australian Prudential Regulatory Authority showed ANZ went backwards 0.1 per cent in the owner-occupier housing market and saw the same marginal growth of 0.1 per cent in investor mortgages compared with November.

ANZ chairman Paul O’Sullivan told shareholders in November that the bank expected its Australian home loan portfolio to return to growth in this half, and for ANZ’s growth to be in line with system growth some time in the second half of this financial year.

National Australia Bank recorded the strongest month-on-month increase of the big four banks at 1.6 per cent across both investor and owner-occupier mortgages. Macquarie Bank continued its strong trajectory, up 5.2 per cent, while Westpac continued to retreat from investor mortgages, down 0.7 per cent compared with November.

RateCity director of research Sally Tindall said investor mortgage growth had slowed across the board, despite record high levels overall.

‘‘The value of investor loans hit another record high this month, but the pace has notably slowed, which could be sign some of the heat is coming out of the market,’’ she said.

Macquarie analysts said in a note that overall housing credit grew at 8.7 per cent on an annualised basis over the three months to December 31.

‘‘On a three-month annualised view, Commonwealth Bank of Australia and National Australia Bank are growing at 1.3 times and 1.6 times system respectively, while ANZ is showing no growth,’’ Macquarie said.

Outside of the majors, Bank of Queensland recorded growth of 1.2 times system on the back of ME bank’s stronger volume growth in the past month, Macquarie said.

RateCity said the banks had increased their fixed rates by as much as 1 per cent or more over the past year. They were likely to move on standard variable rates even if the Reserve Bank of Australia, which left rates steady yesterday, keeps the cash rate on hold at 0.1 per cent for the rest of 2022.

‘‘Even if the RBA holds out until 2023, there’s a strong chance lenders will hike variable rates regardless, particularly if funding costs continue to escalate,’’ Ms Tindall said.

‘‘A series of cash rate hikes, whenever they come, are likely to put a handbrake on our property market. Anyone borrowing at capacity will see their budget shrink, which could be enough to cool things down, particularly in property hotspots.’’

Ms Tindall also warned that more than a million homeowners have never experienced a rate rise.

‘‘It’s incredible to think there are well over 1.1 million households that have never experienced a cash rate hike,’’ she said. ‘‘Australia hasn’t seen an RBA rate rise in more than 11 years, which means there is a generation of mortgage holders who could be in for a shock when their monthly repayments automatically start rising.’’

Analysts have warned growth in the home loan market would start to slow this year, as credit conditions tighten.

‘‘While most people will be able to take future rate hikes on the chin, albeit through gritted teeth, some people who have been hit hard financially by COVID or who haven’t seen a decent pay rise in some time could find it difficult to balance the budget,’’ Ms Tindall said. ‘‘The data shows the mortgage market is still in full swing. However, future rate rises could shake things up.’’

Owner-occupier home loans grow again in December, but not for ANZ2022-02-09T13:08:08+11:00

Housing market shows ‘fragility’

AFR Article_ 09.02.2022

House prices bounced 1.1 per cent in January, boosted by small gains in Sydney and Melbourne, but the longer-term trend shows a weakening in growth across the capitals, the latest CoreLogic data shows.

All capital cities posted a rise in the median dwelling values during the month, including Melbourne, which rebounded from December’s 0.1 per cent decline.

Brisbane and Adelaide led the charge. Brisbane’s dwelling values rose 2.3 per cent, and in Adelaide they climbed 2.2 per cent, while Hobart and Canberra each gained more than 1 per cent each.

Sydney and Perth rose by 0.6 per cent each, Darwin was up by 0.5 per cent and Melbourne by 0.2 per cent.

‘‘January is a bit harder to read because volumes are much thinner, so I wouldn’t read too much into it, including trends,’’ said Tim Lawless, CoreLogic’s research director.

‘‘Looking at the longer-term trend, though, it’s quite clear that most of the capital cities are slowing in the rate of growth, even Brisbane and Adelaide.’’

In the three months ended January 31, Sydney’s median values rose 1.8 per cent and Melbourne’s increased 0.8 per cent. The gains were markedly lower than the jump recorded in October-December when Sydney’s median values climbed 2.7 per cent and Melbourne’s by 1.5 per cent.

AMP Capital chief economist Shane Oliver said the prospects for interest rate increases would hit every market, but Melbourne would bear the brunt.

‘‘Melbourne is the most exposed because of the large supply overhang, and it has a more fragile economy given the damage done by multiple long lockdowns,’’ he said. ‘‘Sydney is also exposed given the strong price gains in the past year, which created a big affordability problem, forcing people to relocate elsewhere.’’

Brisbane rose 8.3 per cent in the past three months, a 0.2 percentage point drop from October to December.

Hobart posted a 3.4 per cent growth over three months and Canberra 3.7 per cent, also both lower than the October to December quarter.

While home values are still on track to slow sharply in the next 12 months, price growth could re-accelerate in the near term following a steep drop in listings in January, said Louis Christopher, SQM Research managing director.

The number of listings of less than 30 days have plummeted by 27.6 per cent nationwide over the month, with only 49,215 new properties added on to the market, the SQM data shows.

‘‘Vendors appear to be holding off, so there was no sense of panic selling,’’ said Mr Christopher.

‘‘I think the risks have moved to the upside that prices will rise by more than expected during the March quarter.’’

The Reserve Bank of Australia yesterday kept the cash rate at a record low 0.1 per cent, but the central bank upgraded its inflation forecast to 3.25 per cent this year.

Dr Oliver said the RBA could start raising interest rates as early as June, following the higher-than-expected inflation reading last month.

Dr Oliver has lowered his forecast for growth in Sydney and Melbourne to zero and 2 per cent this year, down from his previous forecast of 5 per cent.

Nationally, he now expects prices to rise 3 per cent, down from 5 per cent.

Mr Lawless said the high level of household debt in Sydney and Melbourne also made them more vulnerable to interest rate increases.

‘‘Sydney and Melbourne have much higher median house prices, now both over a million dollars, so arguably household debt levels would be higher as well,’’ he said.

‘‘Sydney is around 10 times debt to income ratio, while Melbourne is approaching nine times, so arguably households would have stretched their budgets a bit more thinly.

‘‘They could be the markets that are a little bit more at risk.’’

Housing market shows ‘fragility’2022-02-09T12:45:23+11:00